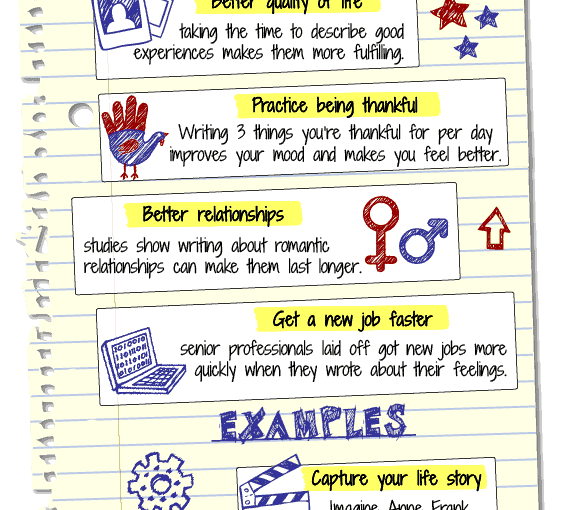
Here is a good quality infographic by FeelingAware about the benefits of starting a journal with examples.

Originally published by FeelingAware.
Here is a good quality infographic by FeelingAware about the benefits of starting a journal with examples.
Originally published by FeelingAware.
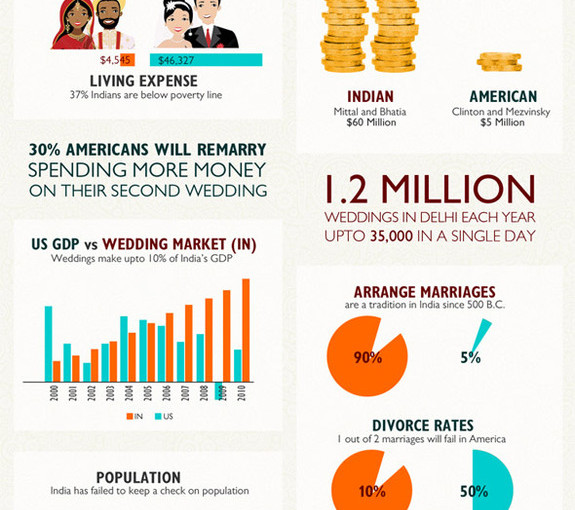
Here is an infographic from the Weddings9 blog which compares Indian weddings to American ones. The infographic has statistics on wedding expense, number of weddings and more.

This infographic was 1st published by the Weddings9 blog.
(Thanks Manmeet)
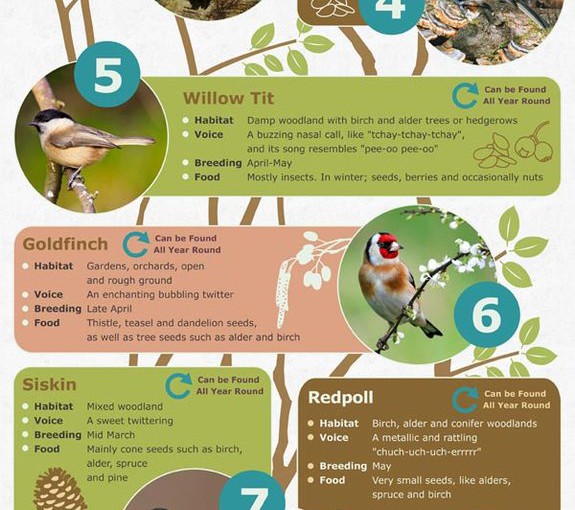
Here is a top notch infographic by the UK holiday village company Center Parcs about woodland birds and where you can find them at the Center Parcs in Sherwood forest.

Originally published at Center Parcs – via Reddit
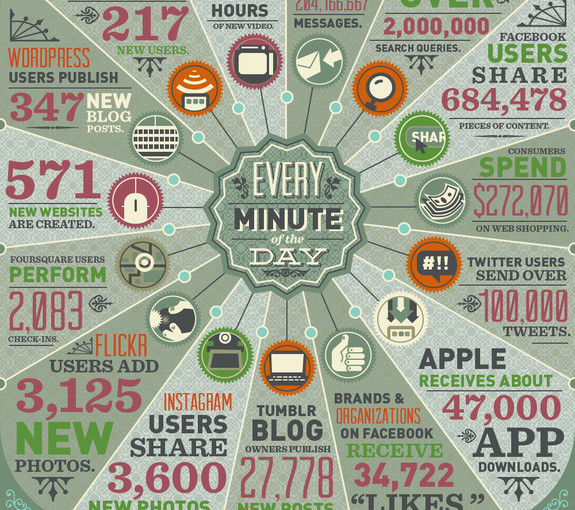
Here is an infographic by Domo.com about how much data is generated every minute. The infographic has stats on Google searches, Youtube uploads, WordPress blog posts and more.

To see a full size version of the infographic click on the image at Domo – via The Daily What

Here is an infographic by Digital Park about how much The Hobbit movie trilogy is estimated to be worth per page of the book. The infographic has sections on the length of the book, runtime and revenue, screen time per page and more.

This infographic was originally published at Digital Park, I found it on Love Infographics.

Here is an awesome infographic by Bearshare about the richest rock stars in the world such as Bono, Sir Paul McCartney, Madonna and more. The infographic also gives information about how the rock stars made their money.

To see the full size infographic visit Bearshare – via Infographic Journal
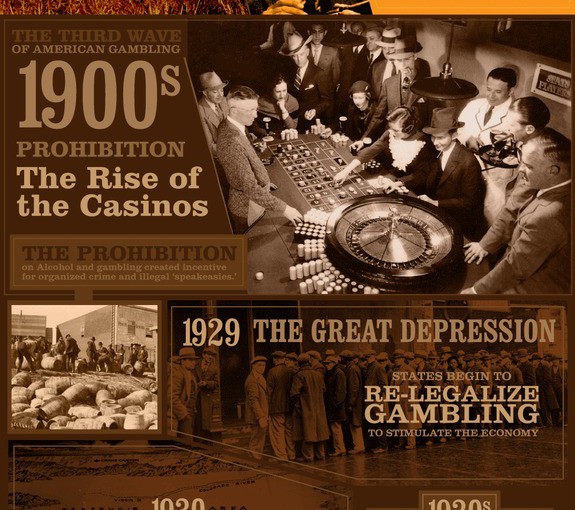
Here is an infographic from the online casino guide Casino.org about the history of gambling in America which starts in the 1600s and goes through to Black Friday in 2011.

To see the full size infographic visit Casino.org.
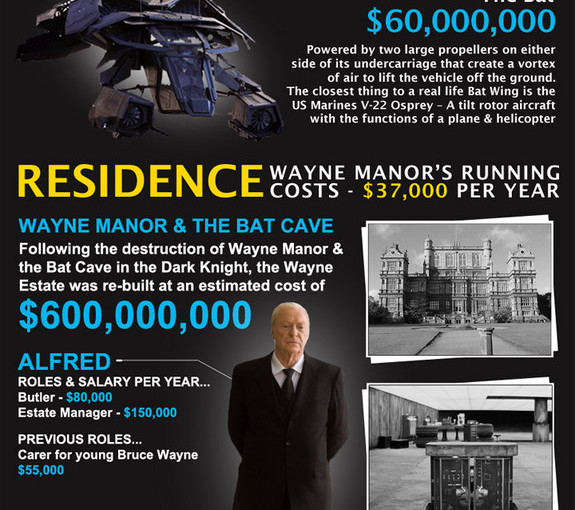
Here is a great infographic from MoneySupermarket about the cost of being batman, for people who have thought about being batman with sections on his suit, his vehicles, Wayne manor, his gadgets and training.

To see a full size version of the infographic go to MoneySupermarket.
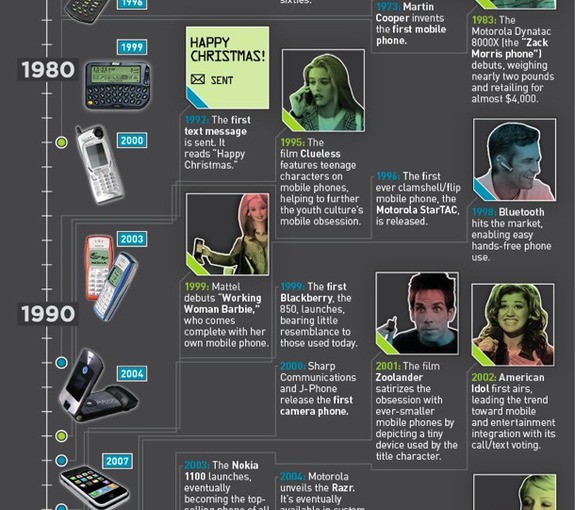
Here is a superb infographic from Product Development Technologies about the evolution of mobile phones which starts in 1970 and goes right through to 2011. It’s a little bit old now and was created last year, but it was so great I just had to feature it.

I found this gem on Business Insider.