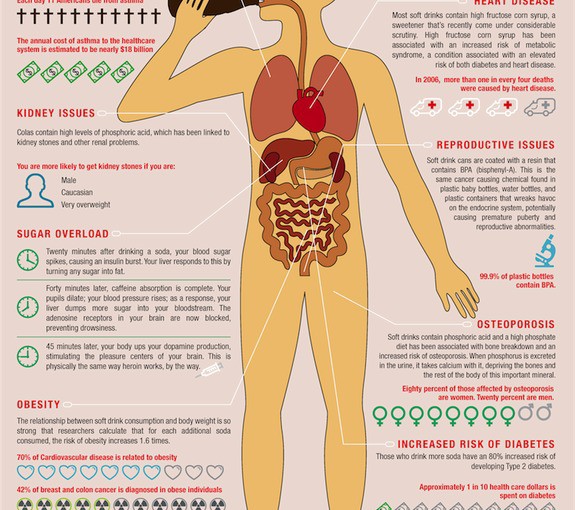
Here is a pretty scary infographic by Term Life Insurance which gives information about how soft drinks can be bad for your health.

To see the full size version visit Term Life Insurance – via Bits & Pieces
Here is a pretty scary infographic by Term Life Insurance which gives information about how soft drinks can be bad for your health.
To see the full size version visit Term Life Insurance – via Bits & Pieces
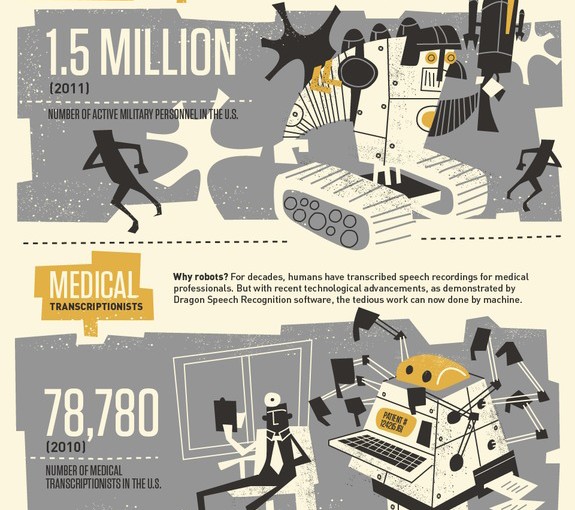
Here is an interesting infographic by Mindflash that provides information about jobs that could be done by a robot. It’s a little bit old now as it was 1st published in September last year, but it is a good one.

To see a full size version of the infographic click on the image at Mindflash – via The Presurfer
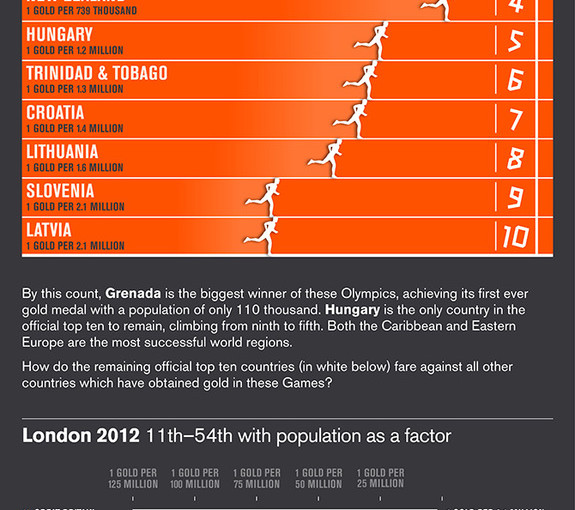
Here is an awesome infographic by Paulo Estriga which provides information about which countries did the best in the London 2012 Olympic games. The infographic has sections on the official top 10 and top 10 with population as a factor.

This infographic was originally published at CargoCollective.com – via Cool Infographics
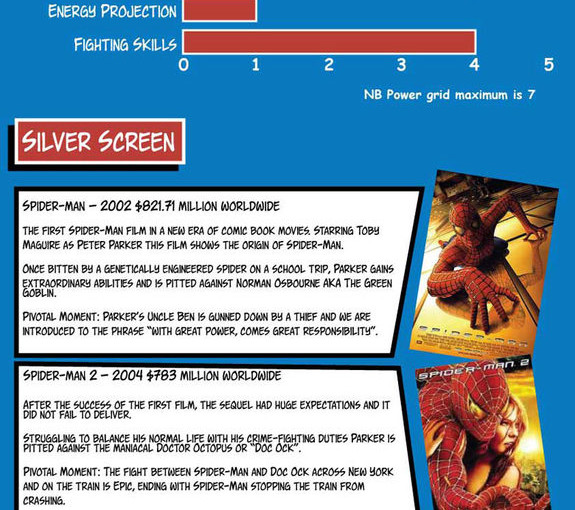
Here is an infographic from MoneySupermarket about the history of Spider-man with sections about the many faces of spider-man, other versions, rankings, the silver screen and more.

To see a full size version head over to MoneySupermarket.
(Thanks Stefan)
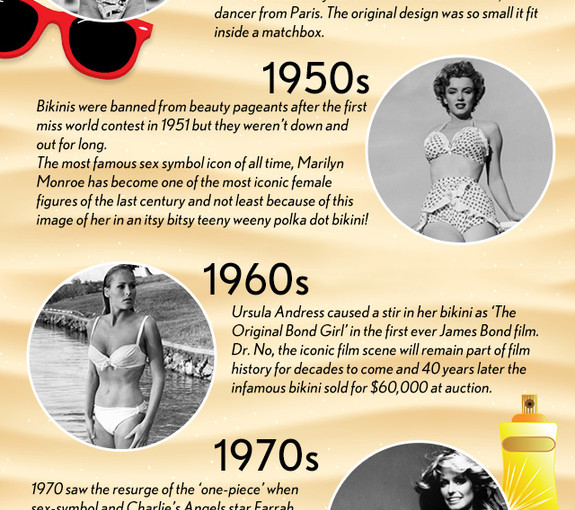
Here is a cool infographic by Swimwear365 about the history of swimwear which starts at the beginning of the 1900s and goes right through to the 2010s.

I found this one over at Infographic Journal.
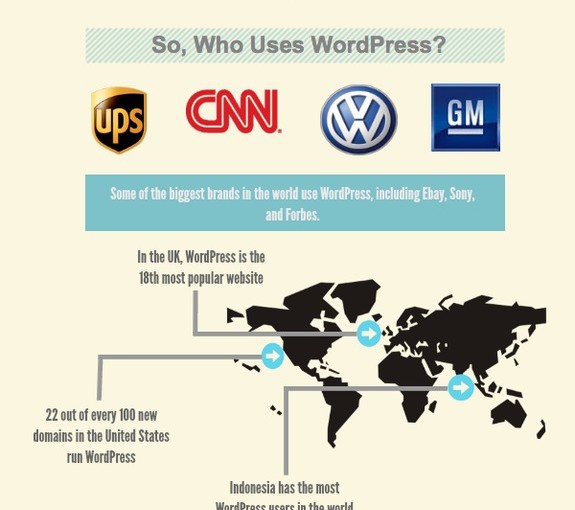
Here is a great infographic by Spark Logix Studios which provides statistics about WordPress usage around the World.

I can’t find where this one was 1st published, I found it on Visual.ly
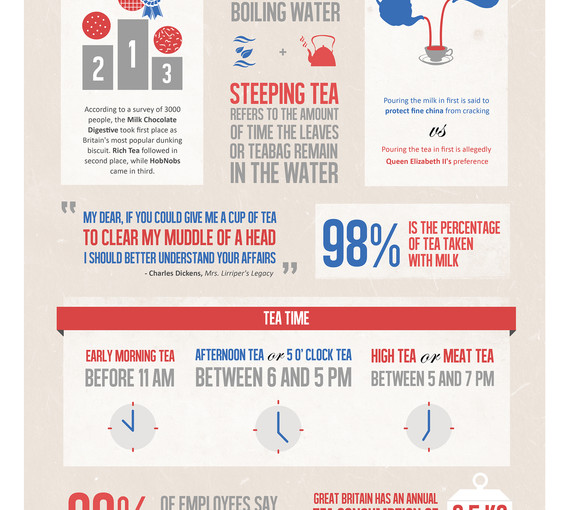
Here is an excellent infographic by Urbanara about British tea. The infographic provides statistics about how many cups of tea people in Britain drink, health benefits of tea and plenty more.

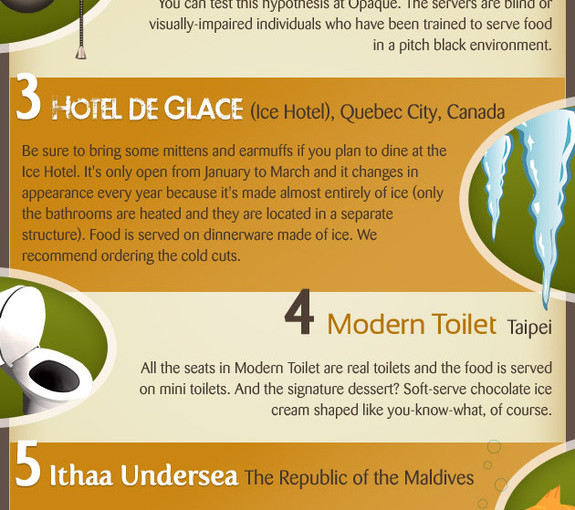
Here is an excellent infographic by Manolith that provides information about eight of the weirdest theme restaurants from around the World.

This one was originally published by Manolith.
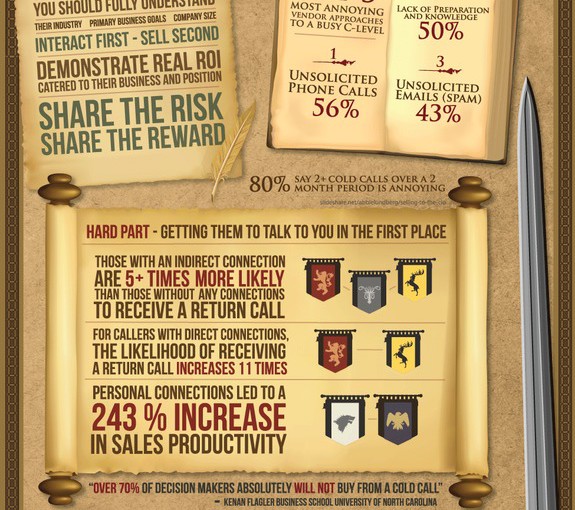
Here is an infographic by sales intelligence company: InsideView called Game of Sales with statistics about cold calling.

To see the full size infographic head over to InsideView.