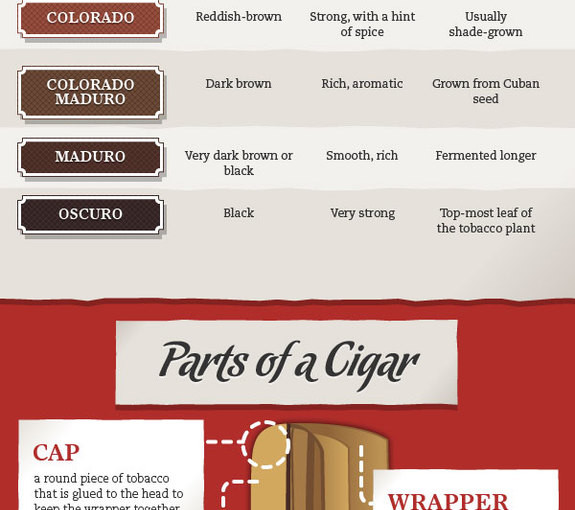
Here is a handy infographic by Cheap Humidors that gives information about cigar smoking with sections on how to smoke a cigar, wrapper classification, parts of a cigar and more.

1st published by Cheap Humidors – via Infographic Database
Here is a handy infographic by Cheap Humidors that gives information about cigar smoking with sections on how to smoke a cigar, wrapper classification, parts of a cigar and more.
1st published by Cheap Humidors – via Infographic Database
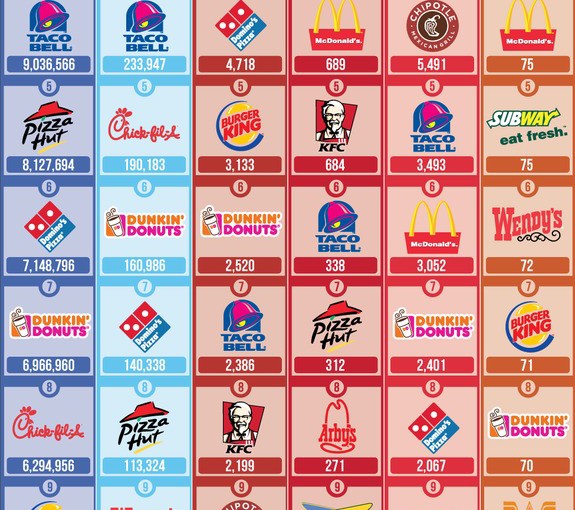
Here is an excellent infographic from the restaurant news site QSRweb.com that provides information about which restaurants in the United States are doing best on social media sites such as Facebook, Twitter and more.

To see the full size infographic click on the image at QSRweb.com
Here is a simple but great infographic from Space Facts that shows all 8 planets in our solar system, Mercury through to Neptune, to scale where one pixel = 279.6 km.

Originally published by Space Facts – via Wired Magazine
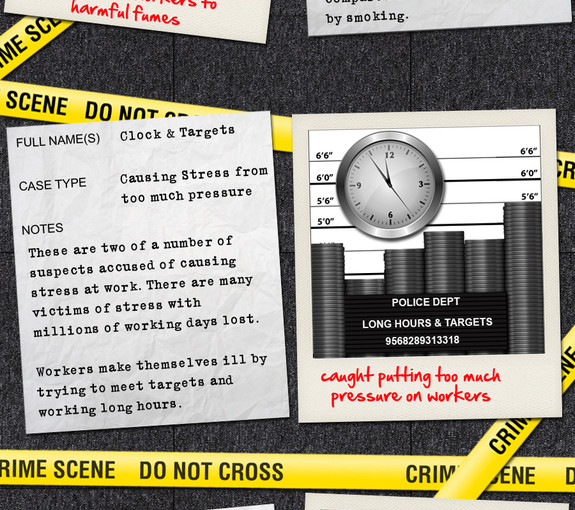
Here is an infographic by Atrium Legal Services that offers information about hidden dangers which cause injuries to office workers everyday.

This one was 1st published by Atrium Legal Services – via Discover Infographics
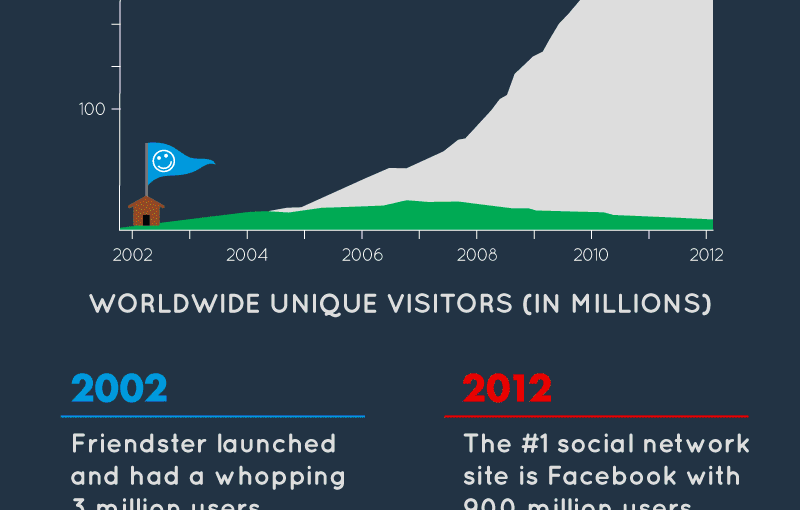
Here is an infographic by Best Education Sites that shows how much the internet has changed over the last 10 years with sections on the growth of the internet, internet usage, the number of websites and more.

Originally published by Best Education Sites – via Mashable
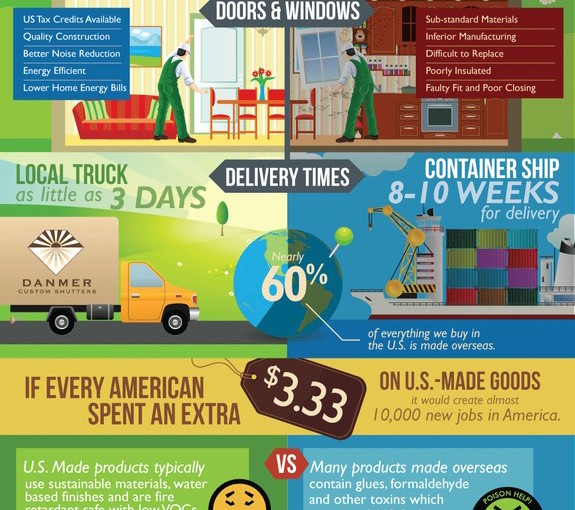
Here is an infographic by Danmer Custom Shutters which compares home products made in the USA to products made in other countries. The infographic has sections on shutters, flooring, doors and windows and more.

To see the full size infographic head over to Danmer Custom Shutters.
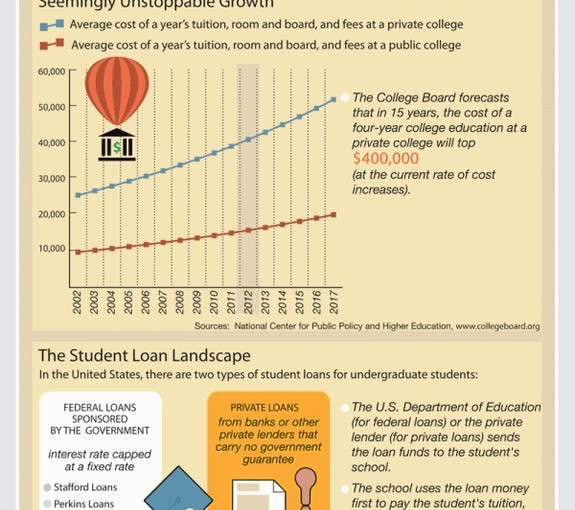
Here is an infographic by School Tutoring about the rising cost of higher education with sections on the rise of college and tuition fees, net college costs, unstoppable growth and more.

This infographic was originally published by School Tutoring – via
The Infographics Showcase
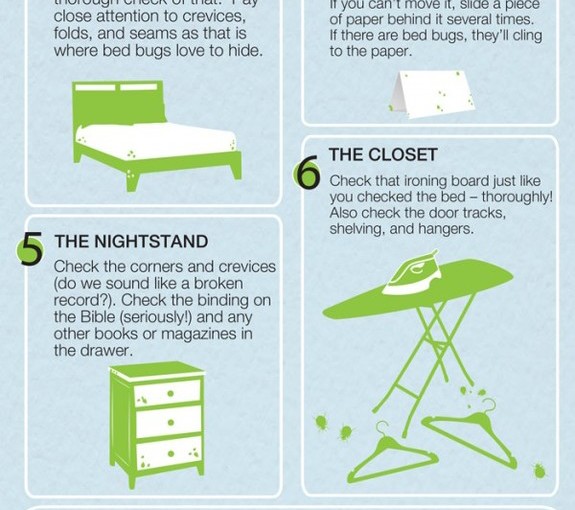
Here is a useful infographic by Moxie Pest Control that provides information about how to check if a hotel room has bed bugs in 7 easy steps and gives advice on what to do if you find bed bugs.

This infographic was created by Moxie Pest Control – via The Infographics Showcase
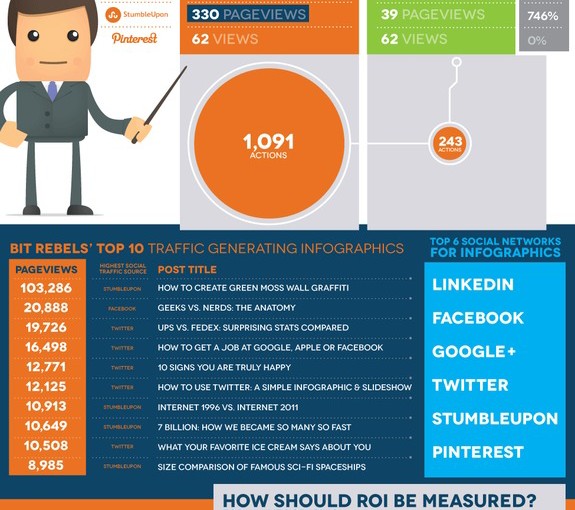
Here is an excellent infographic by Bit Rebels which gives information about the return on investment they have had from the infographics they have published. The infographic has sections on social actions, traffic and how ROI should be measured.

Originally published by Bit Rebels – via Cool Infographics
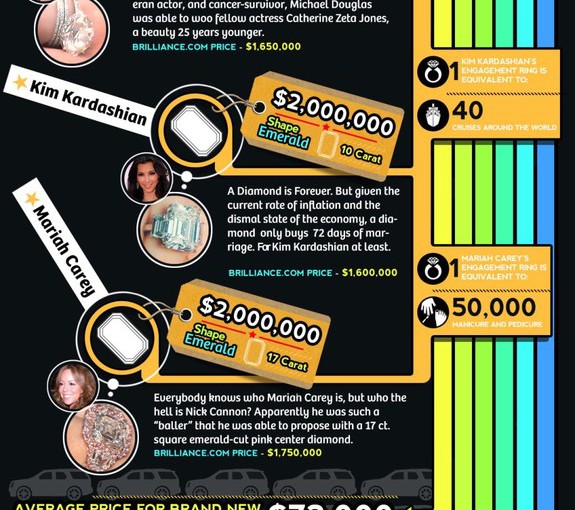
Here is a really good infographic from the United States jewellery website: Brilliance which provides information about the 10 most expensive celebrity engagement rings including the one Brad Pitt gave to Angelina Jolie and 9 more.

This one was originally published on The Brilliance Blog.
(Thanks Therese Shaw)