Moving is stressful, but deciding whether to rent or own your home doesn’t have to be. Check out this infographic for all the questions you should ask yourself before you start packing.

Courtesy of: SpareFoot
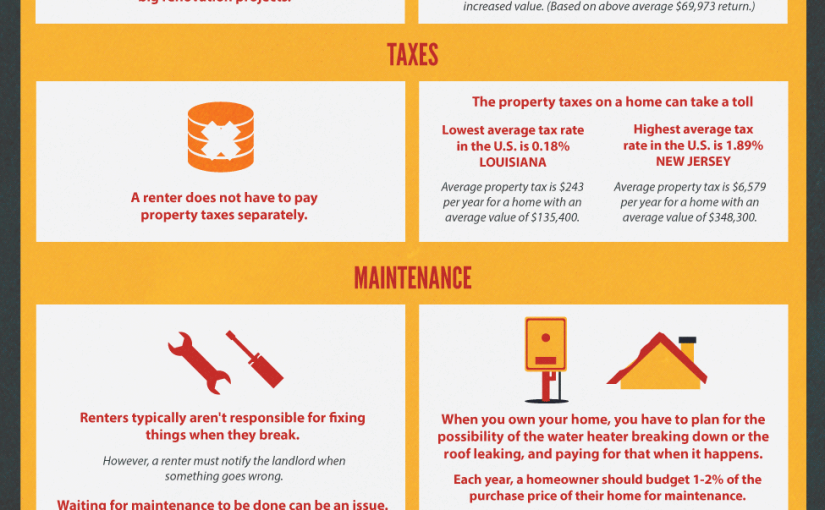
Moving is stressful, but deciding whether to rent or own your home doesn’t have to be. Check out this infographic for all the questions you should ask yourself before you start packing.
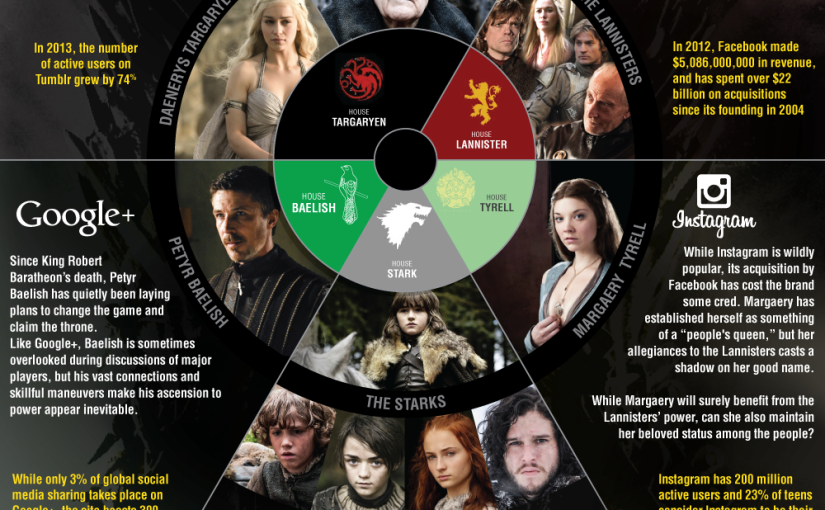
Which is more competitive, Game of Thrones or social media? Check out this infographic for more.

Brought to you by Social Marketing Software by Marketo
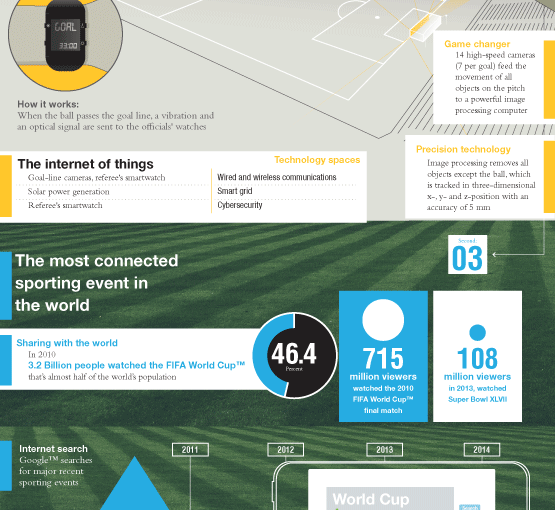
Learn about various forms of new technology being showcased at the World Cup. Check out this infographic for more.

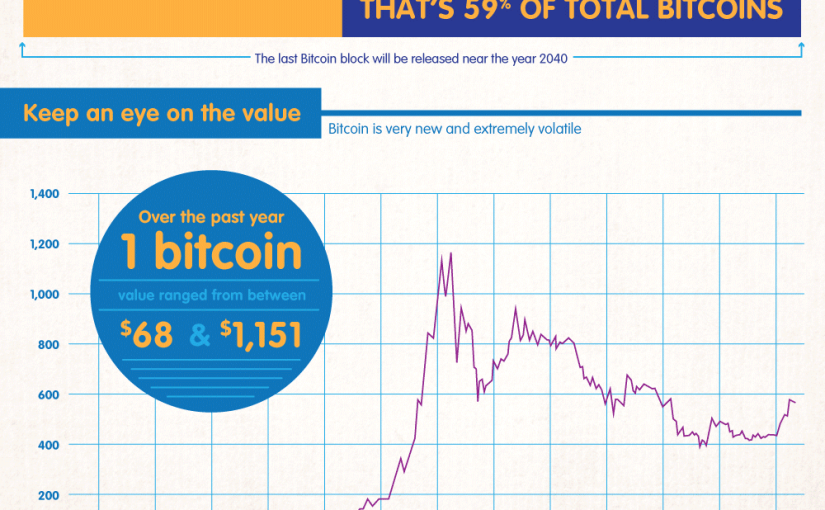
Bitcoin has been hailed as the future of currency. Learn more from this handy infographic.
![Bitcoin: The Future of Currency? [infographic]](https://i0.wp.com/www.mobilepaymentstoday.com/images/is-bitcoin-the-future-of-currency.png?w=500)
Bitcoin: The Future of Currency? [infographic]
Compliments of MobilePaymentsToday.com
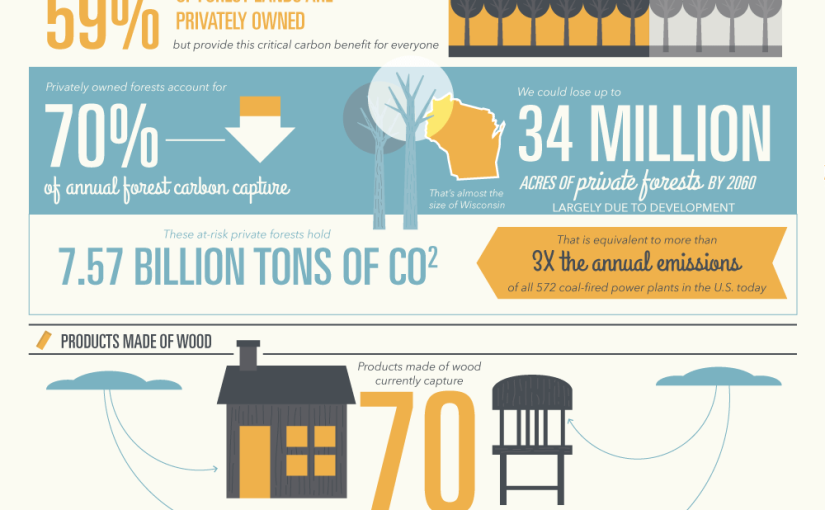
How can we more effectively use forests? Can it be done in a way that combats climate change? Check out this infographic for more.

Source: American Forest Foundation
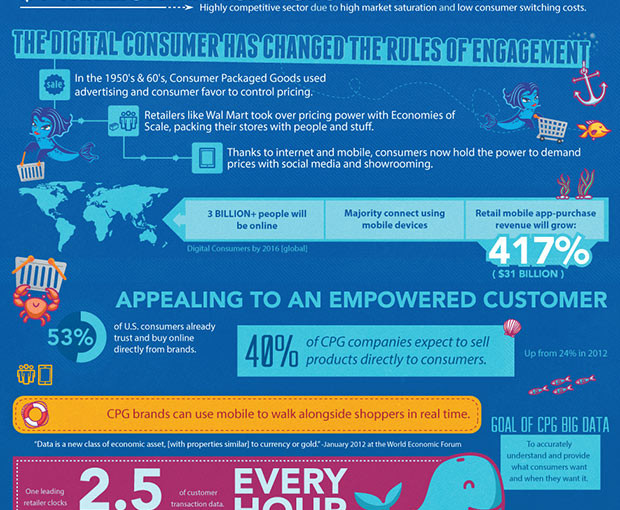
This infographic outlines just how much data is out there for the taking. Are you using your data wisely?

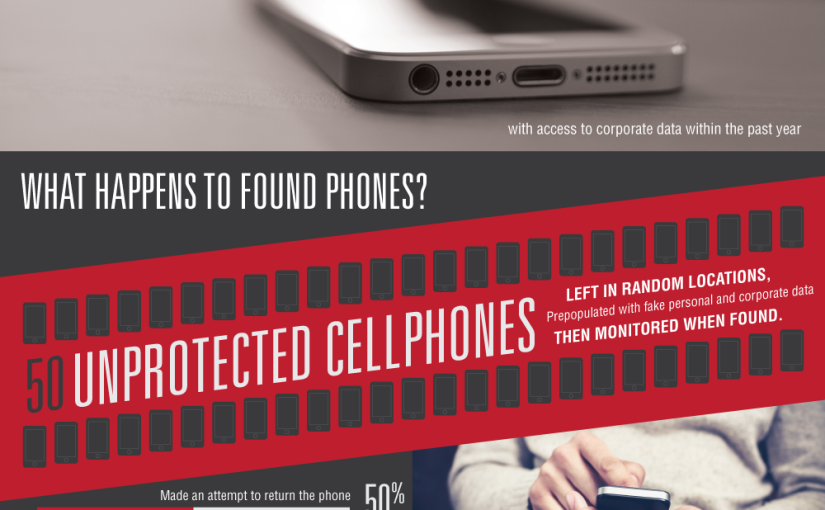
You can protect your company’s data without inconveniencing your employees. Check out this infographic for ways your data is at risk.

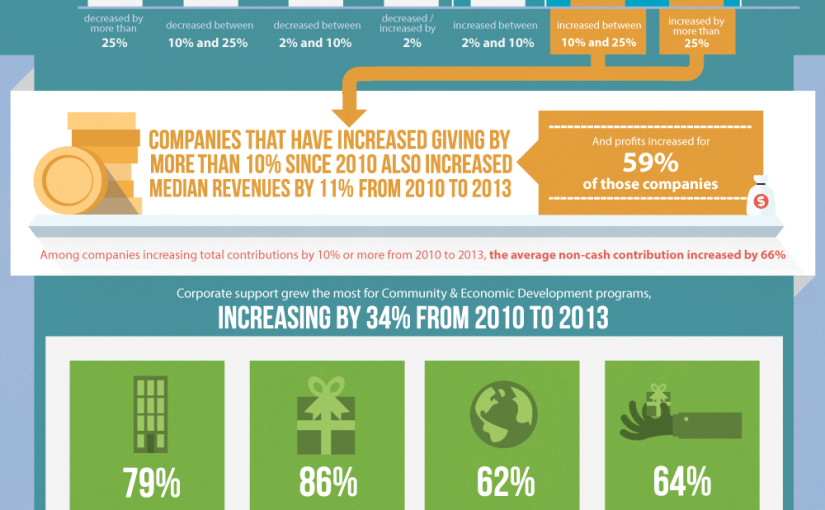
In order to create a better community in which to do business, you must give to charity. Check out this infographic for more.

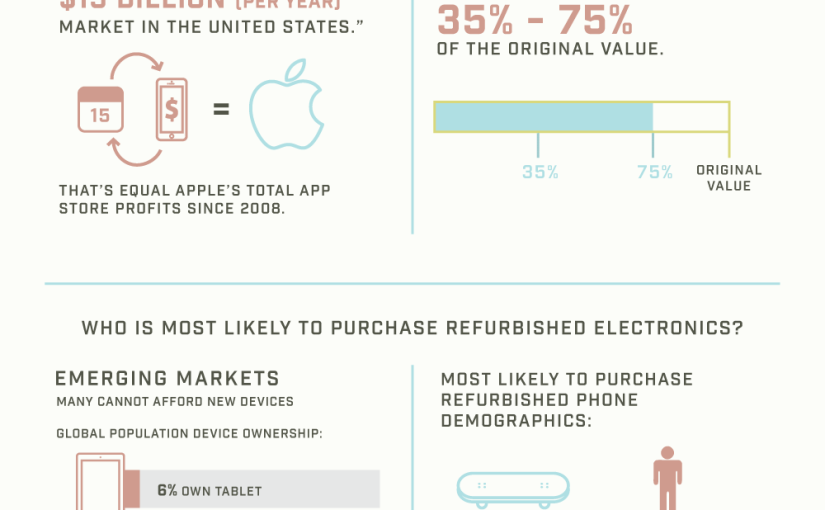
Returned electronics can be costly, but refurbishing them for resale can help. Check out this infographic for more.

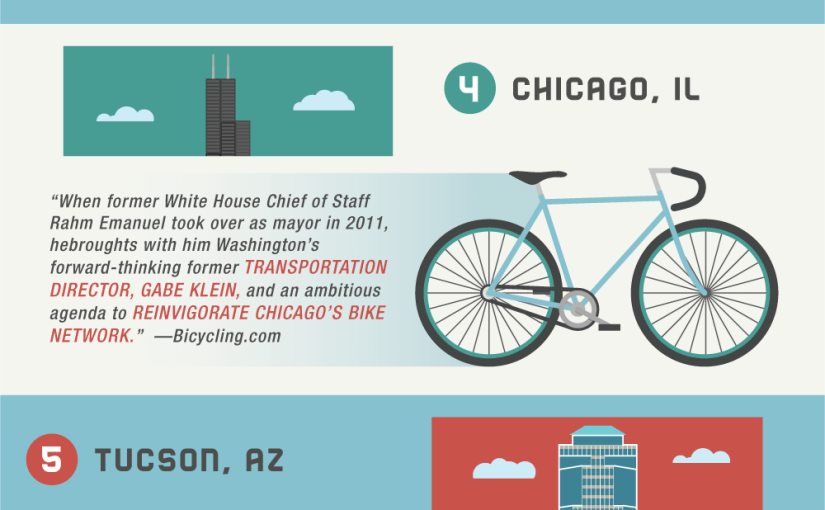
Some cities are very friendly for bikes. Click the link for the interactive infographic!
