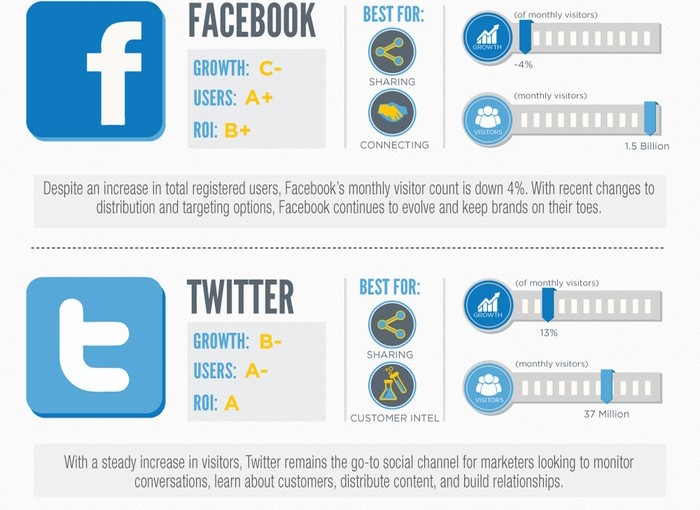
Here is an infographic by marketing automation company Pardot about the winners and losers of social media in 2012. The infographic provides statistics about how many monthly visitors each of the main social networks received, how much they grew and more.
Category: Social Media
-
Stumble Through 2012
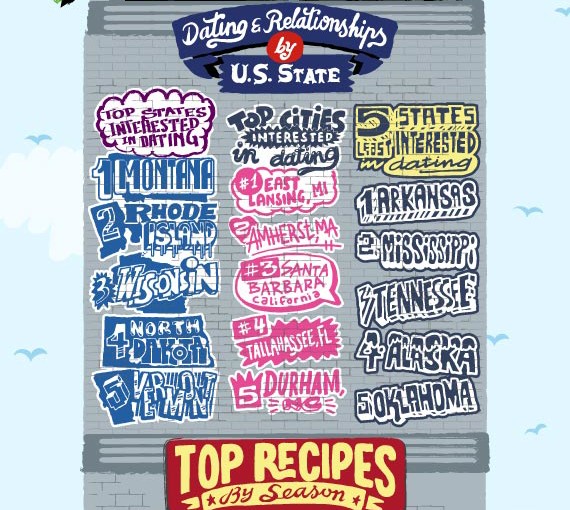
Here is a well designed infographic from one of my favourite social sites Stumbleupon. The infographic provides information about which topics were the most popular on SU in 2012.
This infographic was 1st published on the Stumbleupon blog – via makeuseof
-
The State of Social Media 2012
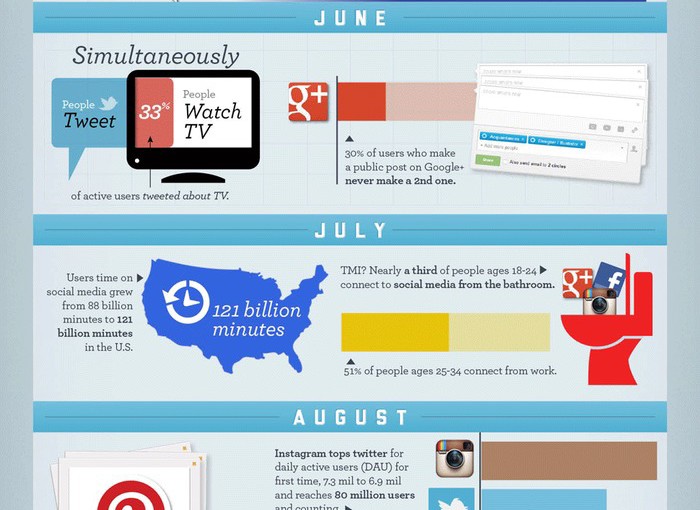
Here is an infographic from my SEO company website about the state of social media in 2012, designed by my friend Brian Wallace from Nowsourcing. We 1st created it back in May and have just updated it so that includes all of the most important things that have happened in social media in 2012 from January through to December.
To see the full size infographic visit The SEO Company
-
Facebook Psychology: Is addiction affecting our minds?
Here is an interesting infographic for FaceBook lovers from the psychology website Best Masters in Psychology. The infographic gives information about how Facebook is addictive like a drug and loads more stuff.
To see the full size infographic then go to Best Masters in Psychology
-
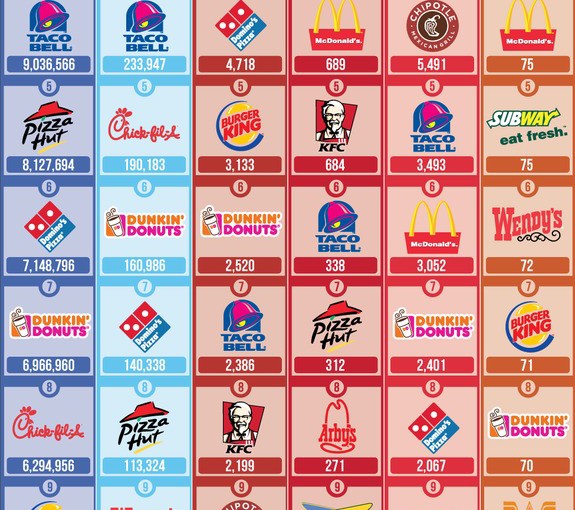
Restaurant Social Media Top 10
Here is an excellent infographic from the restaurant news site QSRweb.com that provides information about which restaurants in the United States are doing best on social media sites such as Facebook, Twitter and more.
To see the full size infographic click on the image at QSRweb.com