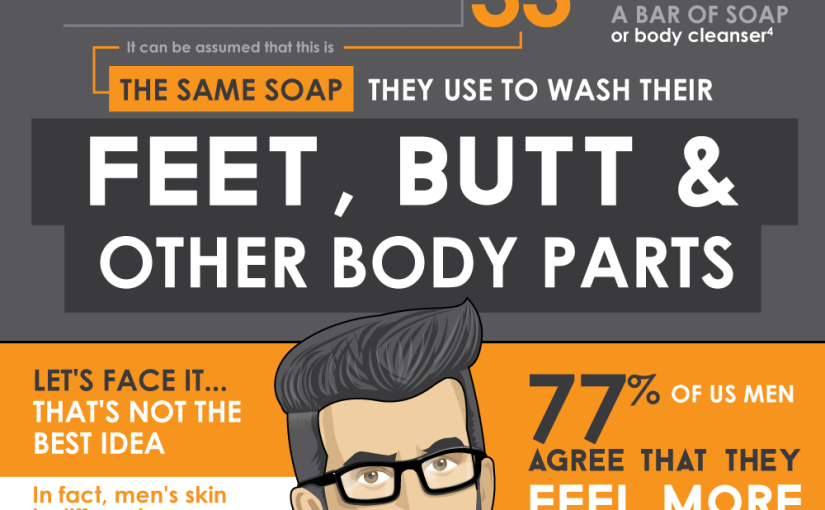
You spend time working out and picking out the right clothes, so why are you neglecting your face? Learn more about skincare for men from this infographic!
Category: Lifestyle
-

What’s In YOUR Subscription Box?
Lots of people have hopped on board the subscription box train, because who doesn’t like getting fun things in the mail? Learn all about the subscription box craze from this infographic!
-
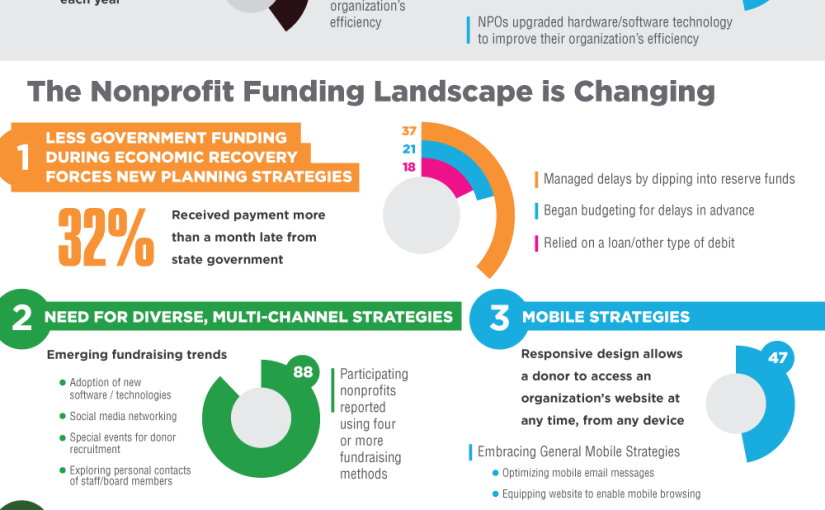
State Of Nonprofits In America
The economy has taken its toll and now nonprofits are being pushed to the max. Learn about the state of nonprofits from this infographic.
-

You Might Not Want To Buy That Home After All
There was a time in the not-so-distant past that buying a home was almost always a good idea. Learn more about the pros and cons of buying versus renting from this infographic.
-
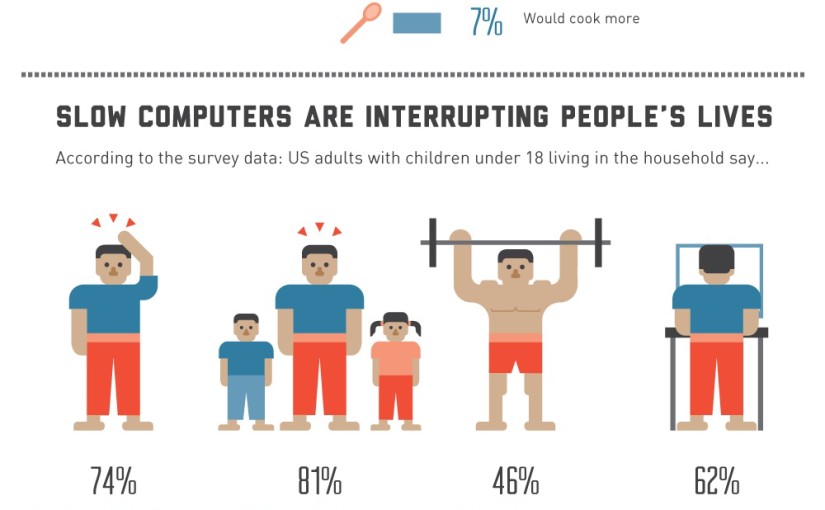
Computer Hogging Your Family Time?
Slow computers are wasting your time. The average American spends sixteen minutes a day waiting for slow computers to load. This infographic breaks down computer-related wasted time and how most people would use recouped time if they upgraded their technology.
-

Christmas Spending
What are the most popular Christmas gifts? And what are people spending? Check out the infographic below to learn the answers to these questions and more!

Christmas Spending Infographic – An infographic by the team at Amara
-
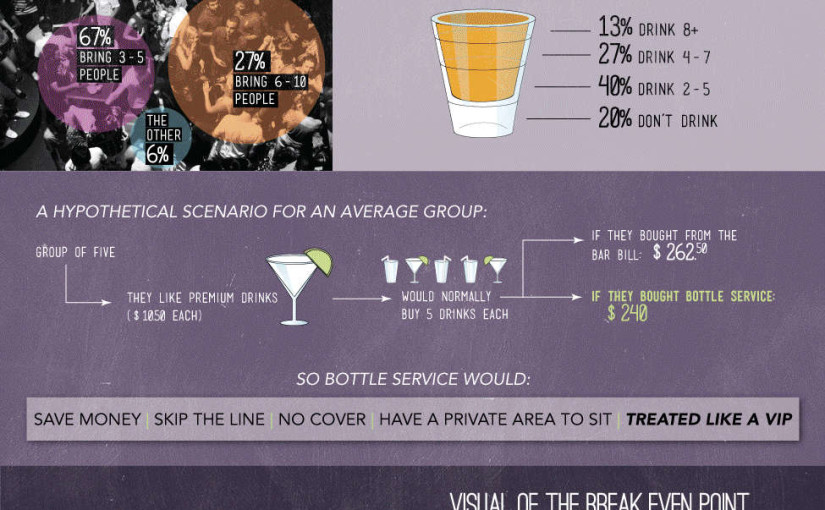
How To Live Large: What’s It Like To Be A VIP?
Who wouldn’t want to be VIP? Check out this infographic from VIP Bidding to learn about VIP and just how great it really is.
-
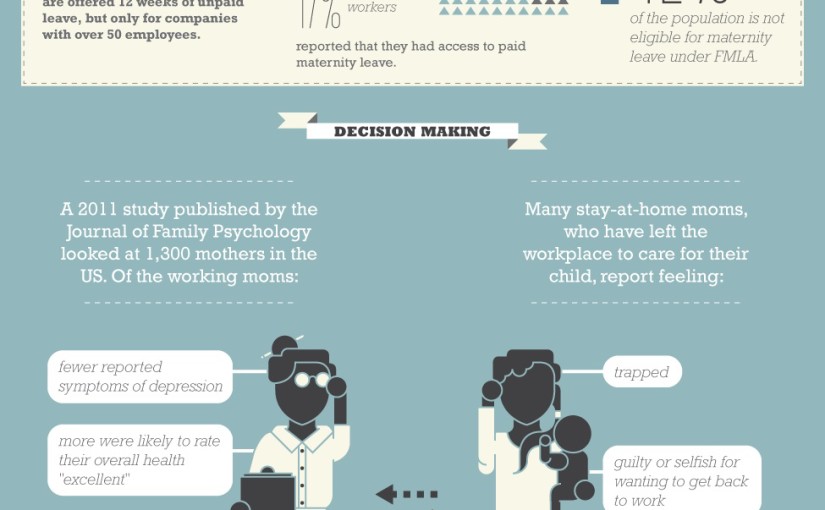
Work After Baby
For American women, the return to work after giving birth may prove difficult. Sixty-two percent of women are employed after giving birth. Employers are not required to pay their employees who are given their 12 weeks of leave. Those women who do return to work report more positive psychological health, as opposed to the mothers who stay at home, who generally report more negative feelings. To learn more about working after having a baby, check out the infographic below, presented by Human Resources MBA.
-
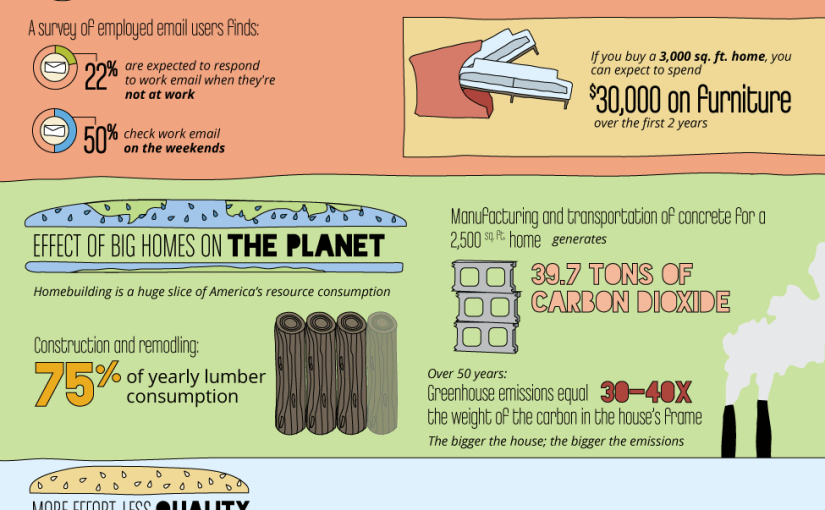
Is Your McMansion Killing You?
We could learn a thing or two from the average household of the 1950s. For some reason, we now think it’s okay to eat fast food every day of the week and to hide behind our TV screens for hours on end. Changes need to be made. Check out this infographic to find out just how the ’50s folks did it better.
 Courtesy of: HomeInsurance.com
 -

The Lottery’s Biggest Winning Losers
Americans seem to naturally live in debt, but every once in a while, someone gets lucky and hits the jackpot. While winning the lottery sounds like the answer to every problem you’ve ever had, it can really have a profoundly awful effect on your life.
Forty-four percent of lotto winners spend their entire winnings within five years. Many winners end up eventually filing for bankruptcy or divorce.
In this infographic, Casino.org takes a look at some famous and infamous lotto winners as well as a global take on hitting the jackpot.
© 2013 Casino.org
