Category: Internet
-
Why American Internet is Lagging
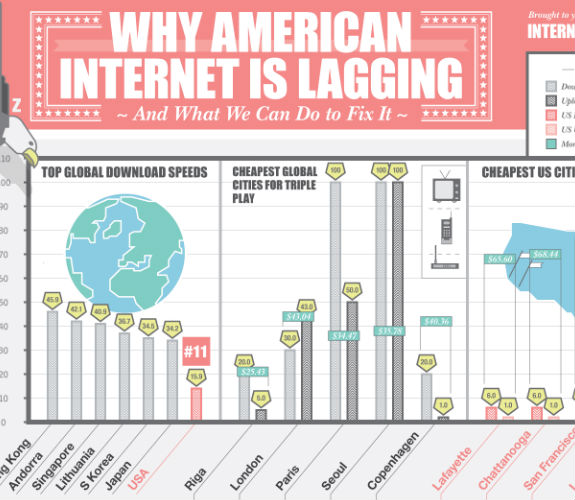
In the United States, Internet accessibility doesn’t extend to everyone. Ten percent of Americans don’t have access to basic broadband because of where they live. When it comes to the Internet, America just doesn’t match up to countries with greater accessibility, faster download speeds, and lower prices. In this infographic, InternetProviders.com explores Internet services around…
-
Choosing the Right Mobile Payment Option
Everything is going mobile, even bill pay. With this rise in mobile comes many options, so which is best for you? Check out this infographic presented by Merchant Warehouse to learn more about the rise of mobile payments and the different options available. Brought to you by Merchant Warehouse
-
The History of Microsoft Office
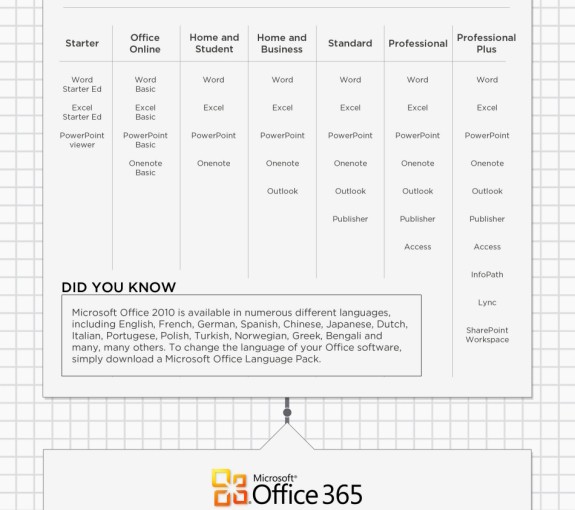
Here is an infographic that will take you back from UK based Microsoft Office training company Best STL about the history of Microsoft Office. The infographic has information about each version that has been released since 1990 and includes an Office 2013 preview. This one is a little blurry so head over to Best STL…
-
Global Ecommerce Markets Infographic
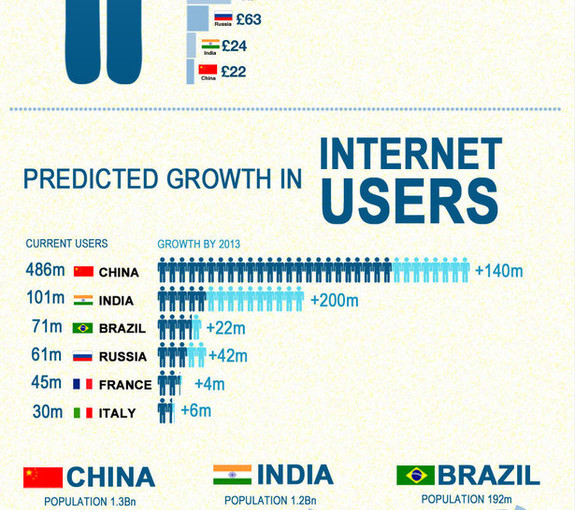
Here is a very interesting infographic by UK based search engine marketing company Search Laboratory about global ecommerce markets and what opportunities exist for online retailers. The infographic has sections on ecommerce worth, ecommerce spend, internet users and ecommerce growth. This one was first published by Search Laboratory – via Econsultancy
-
The Internet a Decade Later
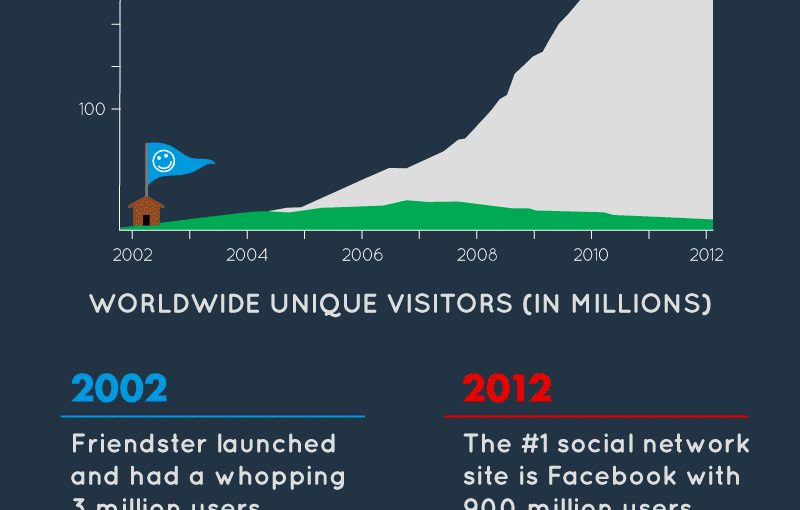
Here is an infographic by Best Education Sites that shows how much the internet has changed over the last 10 years with sections on the growth of the internet, internet usage, the number of websites and more. Originally published by Best Education Sites – via Mashable
-
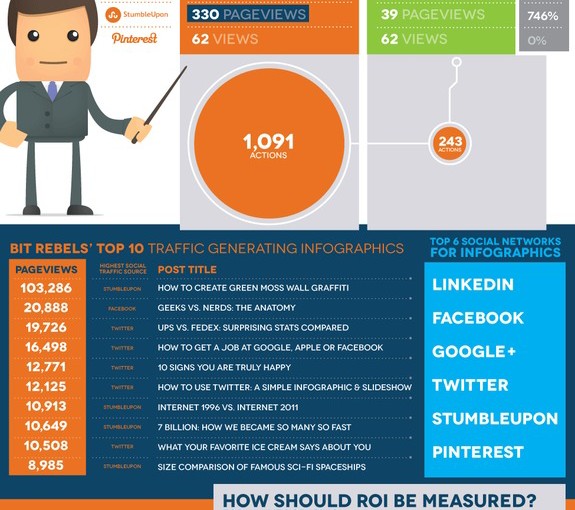
Traffic Impact Of Bit Rebels Infographics
Here is an excellent infographic by Bit Rebels which gives information about the return on investment they have had from the infographics they have published. The infographic has sections on social actions, traffic and how ROI should be measured. Originally published by Bit Rebels – via Cool Infographics
-
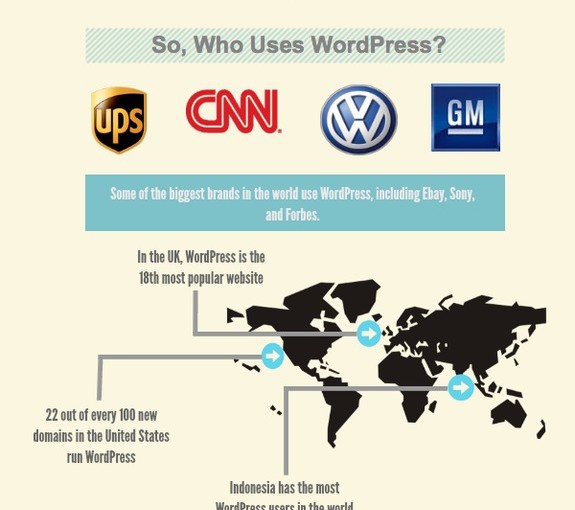
WordPress: The Rise and Use
Here is a great infographic by Spark Logix Studios which provides statistics about WordPress usage around the World. I can’t find where this one was 1st published, I found it on Visual.ly
-
How Much Data is Generated Every Minute?
Here is an infographic by Domo.com about how much data is generated every minute. The infographic has stats on Google searches, Youtube uploads, WordPress blog posts and more. To see a full size version of the infographic click on the image at Domo – via The Daily What
-
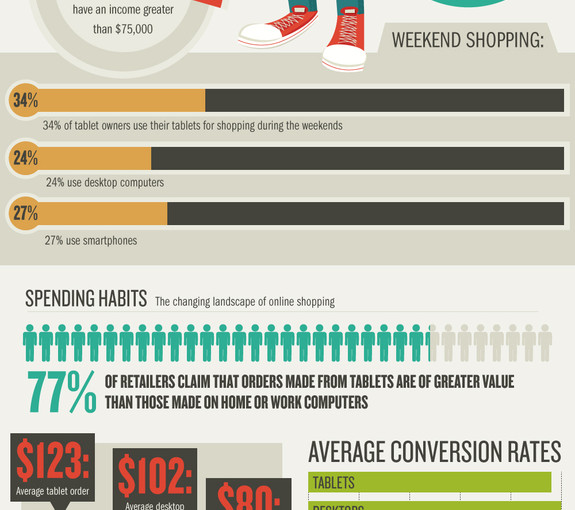
Tablet E-commerce: Portrait of a Tablet Shopper
Here is an awesome infographic from Miva Merchant about tablet use in America with sections on rise of the tablets, portrait of a tablet owner and much more. To see a full size version of the infographic visit Miva Merchant – via Amazing Infographics