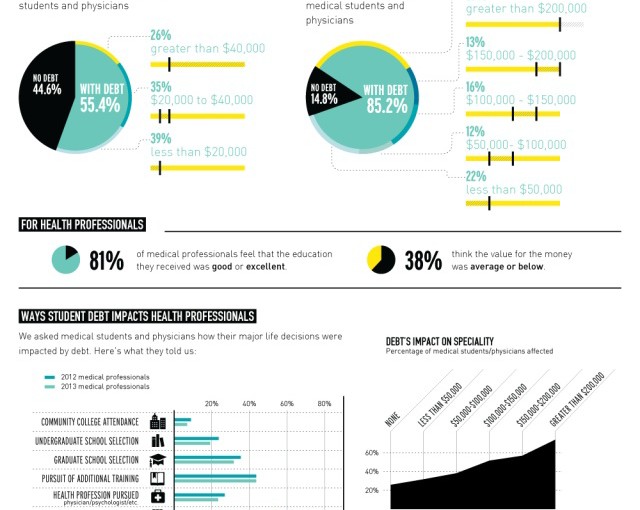
In the past, getting a college degree pretty much guaranteed a solid job. Nowadays, things are by no means as certain. Generation Y is finding it increasingly difficult to land a job, making it extremely challenging to pay off their student loans that average about $25,000 per individual. Check out this infographic presented by Adecco to learn more.


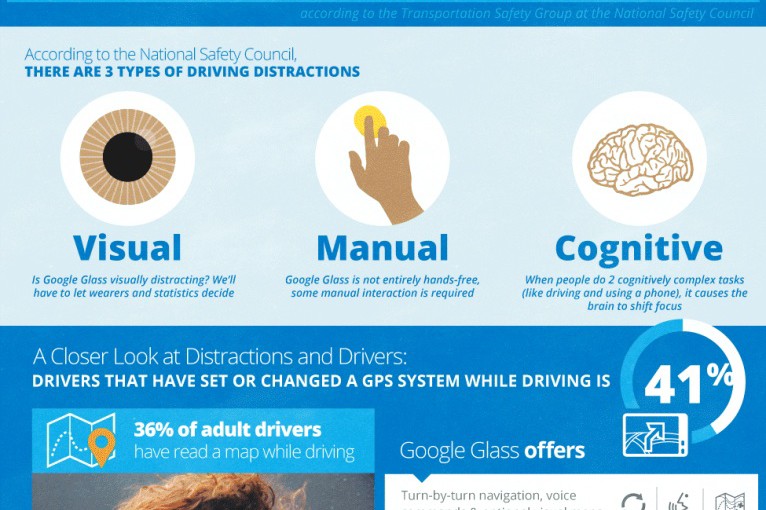
![Driving with Google Glass [Infographic]](https://i0.wp.com/www.carinsurancequotes.com/Media/Default/Infographics/google-glass-650.png?w=600)


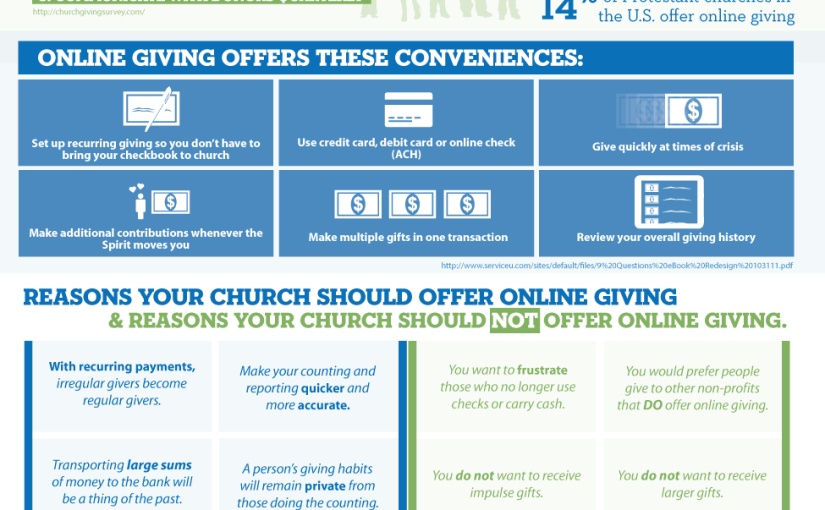
![Online Giving: Is it right for your church? [Infographic]](https://i0.wp.com/www.churchcentral.com/images/Online-Giving-Infographic.png?w=600)