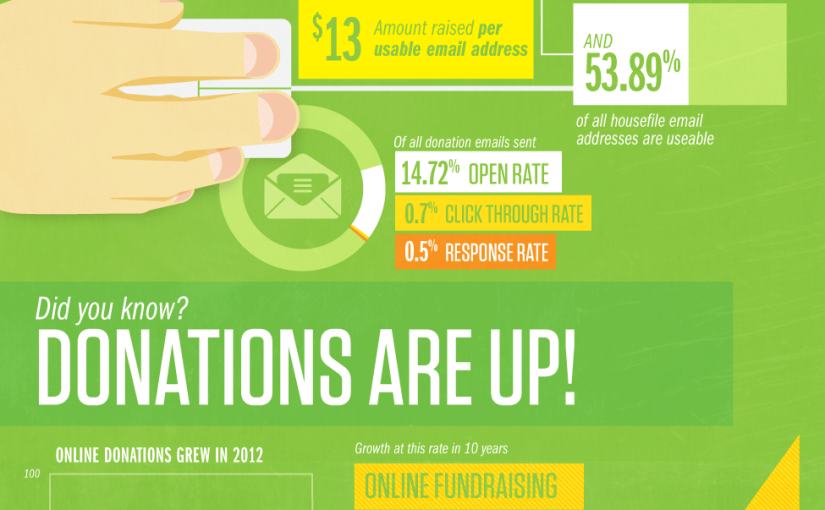
In this infographic presented by Oscar Mayer, stats are explored and show what ranks top on dad’s wish list and what they wish you would’ve left at the store.
Author: Staff
-
Ditch the Tie, Dad wants Bacon!
When it comes to giving Father’s Day gifts, some really struggle to find something that their dear ol’ dad will actually like. After all, very few dads want socks or a new tie. So what are you to do? Go for the gift that is guaranteed to please: bacon. -
A Toast to Wine
Americans now make up the largest wine market in the world, consuming 13 percent of the wine produced globally. Check out the infographic below presented by SpareFoot to learn more interesting facts about America’s love of vino. -
Allergies in the United States
Twenty-six million Americans suffer from seasonal allergies. Certain regions are known to produce the most allergens, while some are known to produce the least, and some areas prevent allergens best. There are day-to-day prevention strategies; and natural cures. To learn how to prevent suffering caused by allergies, check out the infographic below presented by InsuranceQuotes.comFrom: Bankrate Insurance’s InsuranceQuotes.com
-
Work After Baby
For American women, the return to work after giving birth may prove difficult. Sixty-two percent of women are employed after giving birth. Employers are not required to pay their employees who are given their 12 weeks of leave. Those women who do return to work report more positive psychological health, as opposed to the mothers who stay at home, who generally report more negative feelings. To learn more about working after having a baby, check out the infographic below, presented by Human Resources MBA. -
Salary Guide for UX Jobs
Where can UX professionals expect to find a job, and how much should they expect to get paid? Based on job posting numbers, the top city for UX jobs is New York City, followed by San Francisco and Seattle, and the specific areas most in demand are in development and design. To learn more about UX salaries and locations, check out this infographic presented by Onward Search.© 2013 Onward Search
-
The Brain of a Serial Killer
From 2000-2010, 412 people were killed by serial killers. So what makes a serial killer tick? Motivation for killing varies, but generally it is to obtain money, experience a thrill, give the killer a sense of power, or to ridding the world of evildoers. Though serial killers come in all shapes and sizes, there are certain things that most of them have in common. To learn more about serial killers and what they have in common, check out the infographic below.
Image compliments of Best Counseling Degrees -
How to Negotiate a Higher Salary
When it comes to negotiating a higher salary, many people become anxious, or simply don’t do it at all. Check out the infographic below presented by GradSchoolHub.com to learn how to negotiate the salary you deserve.
Image compliments of Grad School Hub -
The World’s Dirtiest Jobs
There are a lot of dirty jobs out there, but someone has to do them. Check out the infographic below presented by Master-Cleaners.co.uk to learn about the world’s dirtiest jobs.